What it is
The Data Health Audit is a free review of your marketing data. Send us exports from your advertising platforms and online store, and we’ll return a single report that reconciles them day by day and identifies every issue found in the files.
There’s no sign-up or connection required. The audit only reads the files you provide.
Why we built it
Before Lumiqo, I built data pipelines in quantitative finance. In that world, two systems reporting the same number must agree before anything is released.
Marketing has no equivalent check. Meta, Google, and TikTok each count the purchases they believe they drove, while Shopify counts the orders received. The numbers rarely align, especially at the daily level. Every morning, Lumiqo pulls, checks, and cleans the data, reconciles each platform against your store, and delivers it to your warehouse with analytics on top.
At launch, we wanted anyone to be able to run that check on their own numbers without signing up or connecting anything. So we built the Data Health Audit: the same engine, run once on the files you send us, free of charge.
What you send
Exports from your advertising platforms and/or store, exactly as they come from each tool. Send any number of files, covering any date range and any platform: Meta, Google Ads, TikTok, Amazon Ads, GA4, Klaviyo, Shopify, WooCommerce, or a combined file from a tool such as Supermetrics.
There’s no need to clean, rename, or combine anything. The audit tool identifies what each file contains, where it comes from, which columns represent the date, spend, purchases, and revenue, and how to interpret each tool’s native format. That is precisely what the audit is designed to do.
What you get back
One report, delivered as a PDF within 48 hours. It always follows the same structure, with the same sections in the same order, and clearly shows the date range covered. The images come from a sample report for a fictional store, “Rosewell Beauty.”
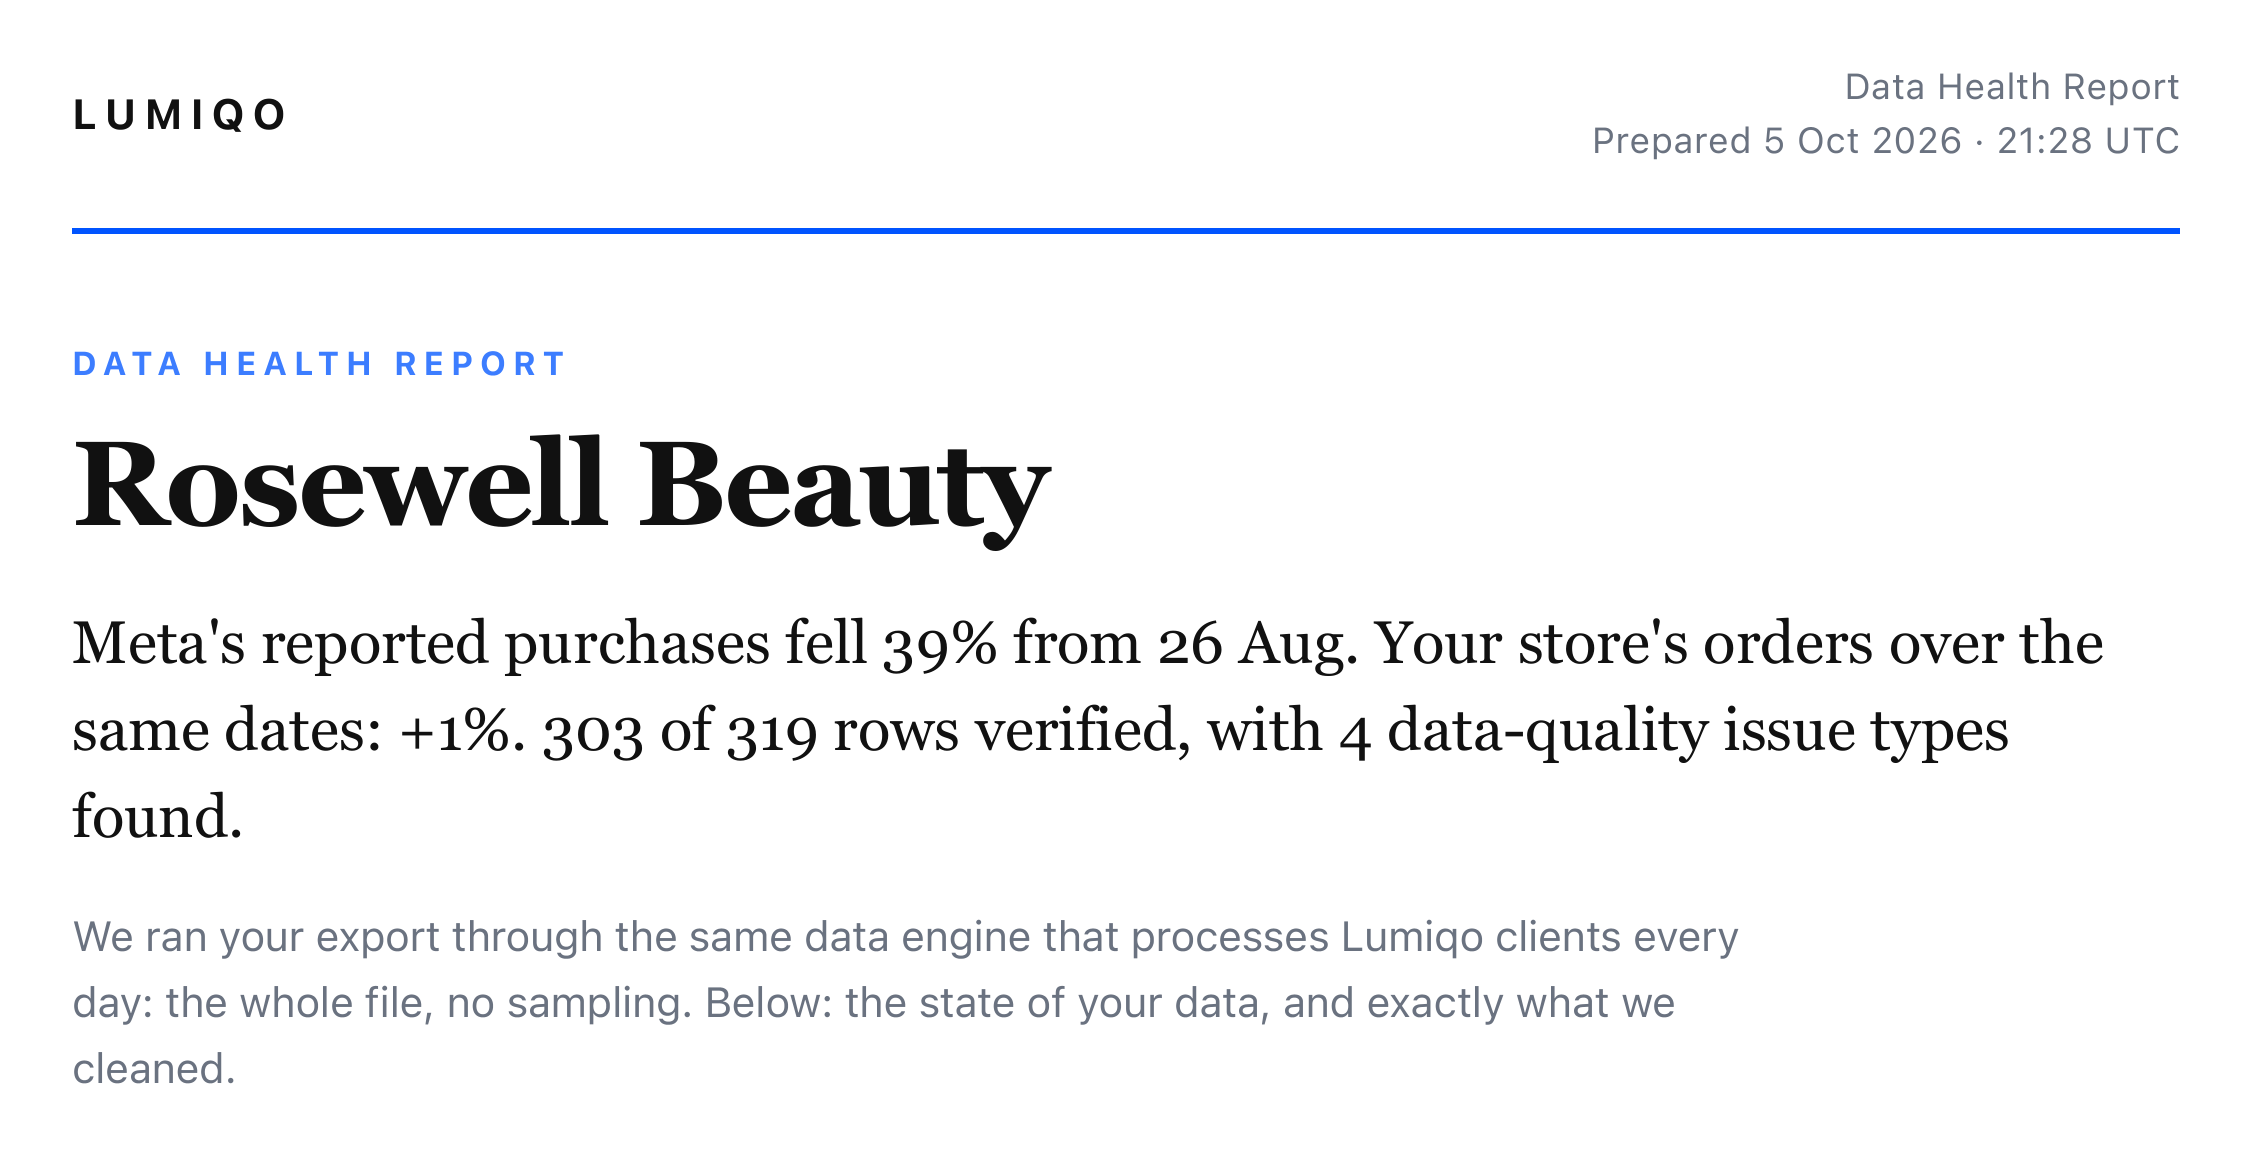
Data Health Report
The first thing you read. It highlights the most important findings in your files in one or two plain sentences, so you know where to look first. If your files are clean, it says so.
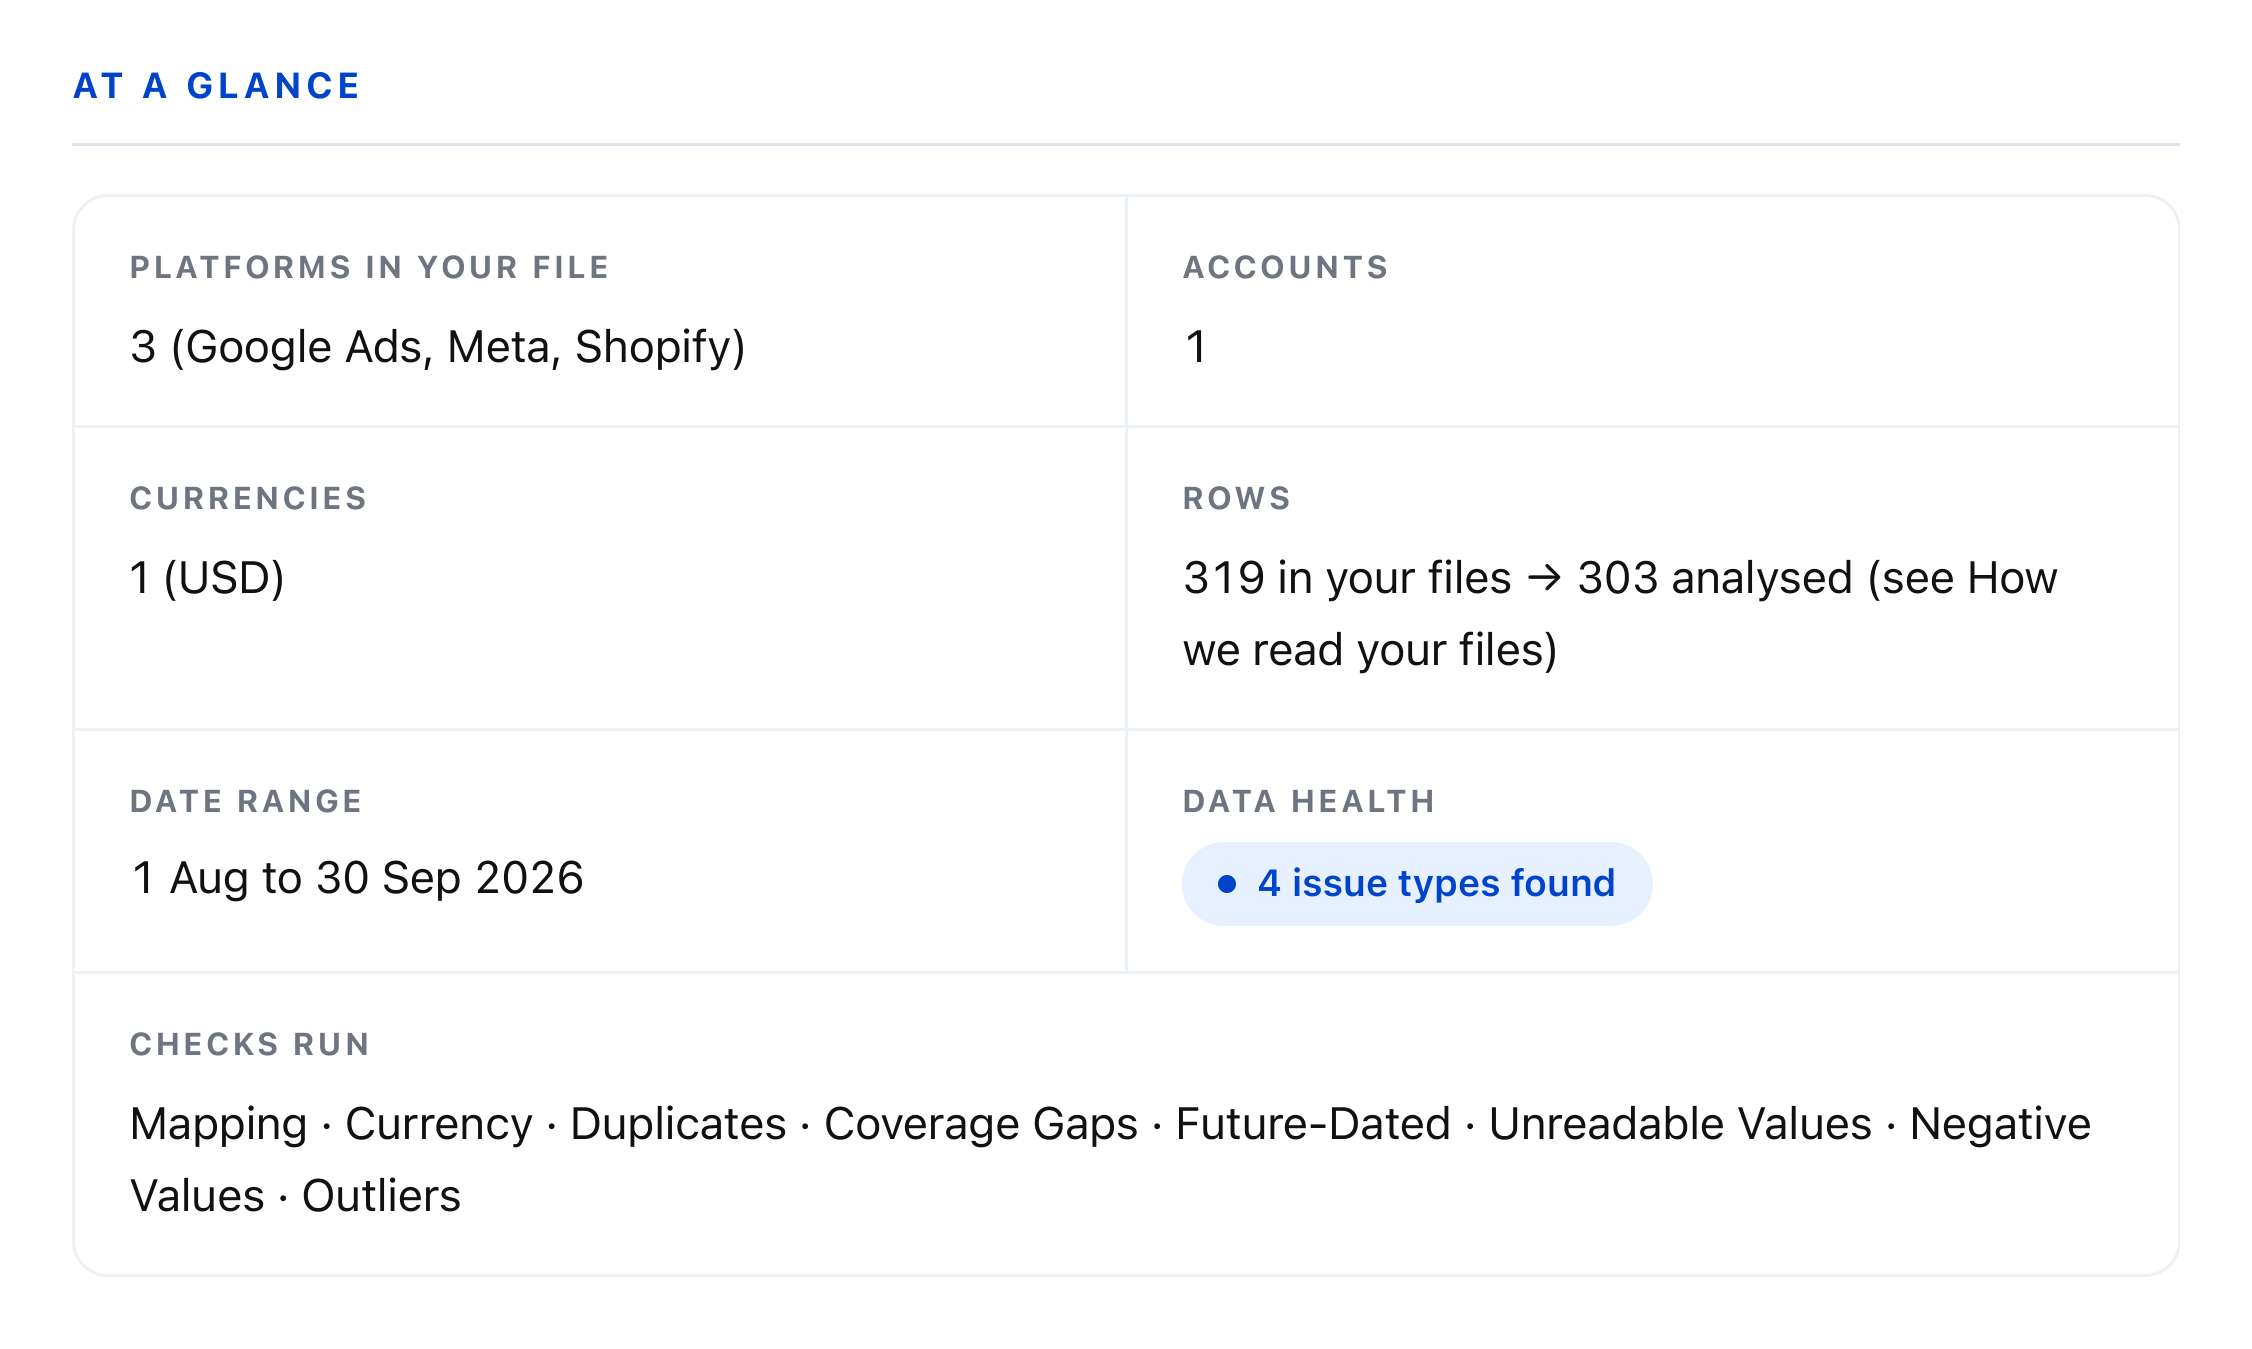
At a glance
A concise summary of what the audit processed: the platforms identified, the number of accounts and currencies, the number of rows received and used, the date range, the types of issues found, and every check that ran. Before showing any detail, it tells you whether the audit captured all of your data.
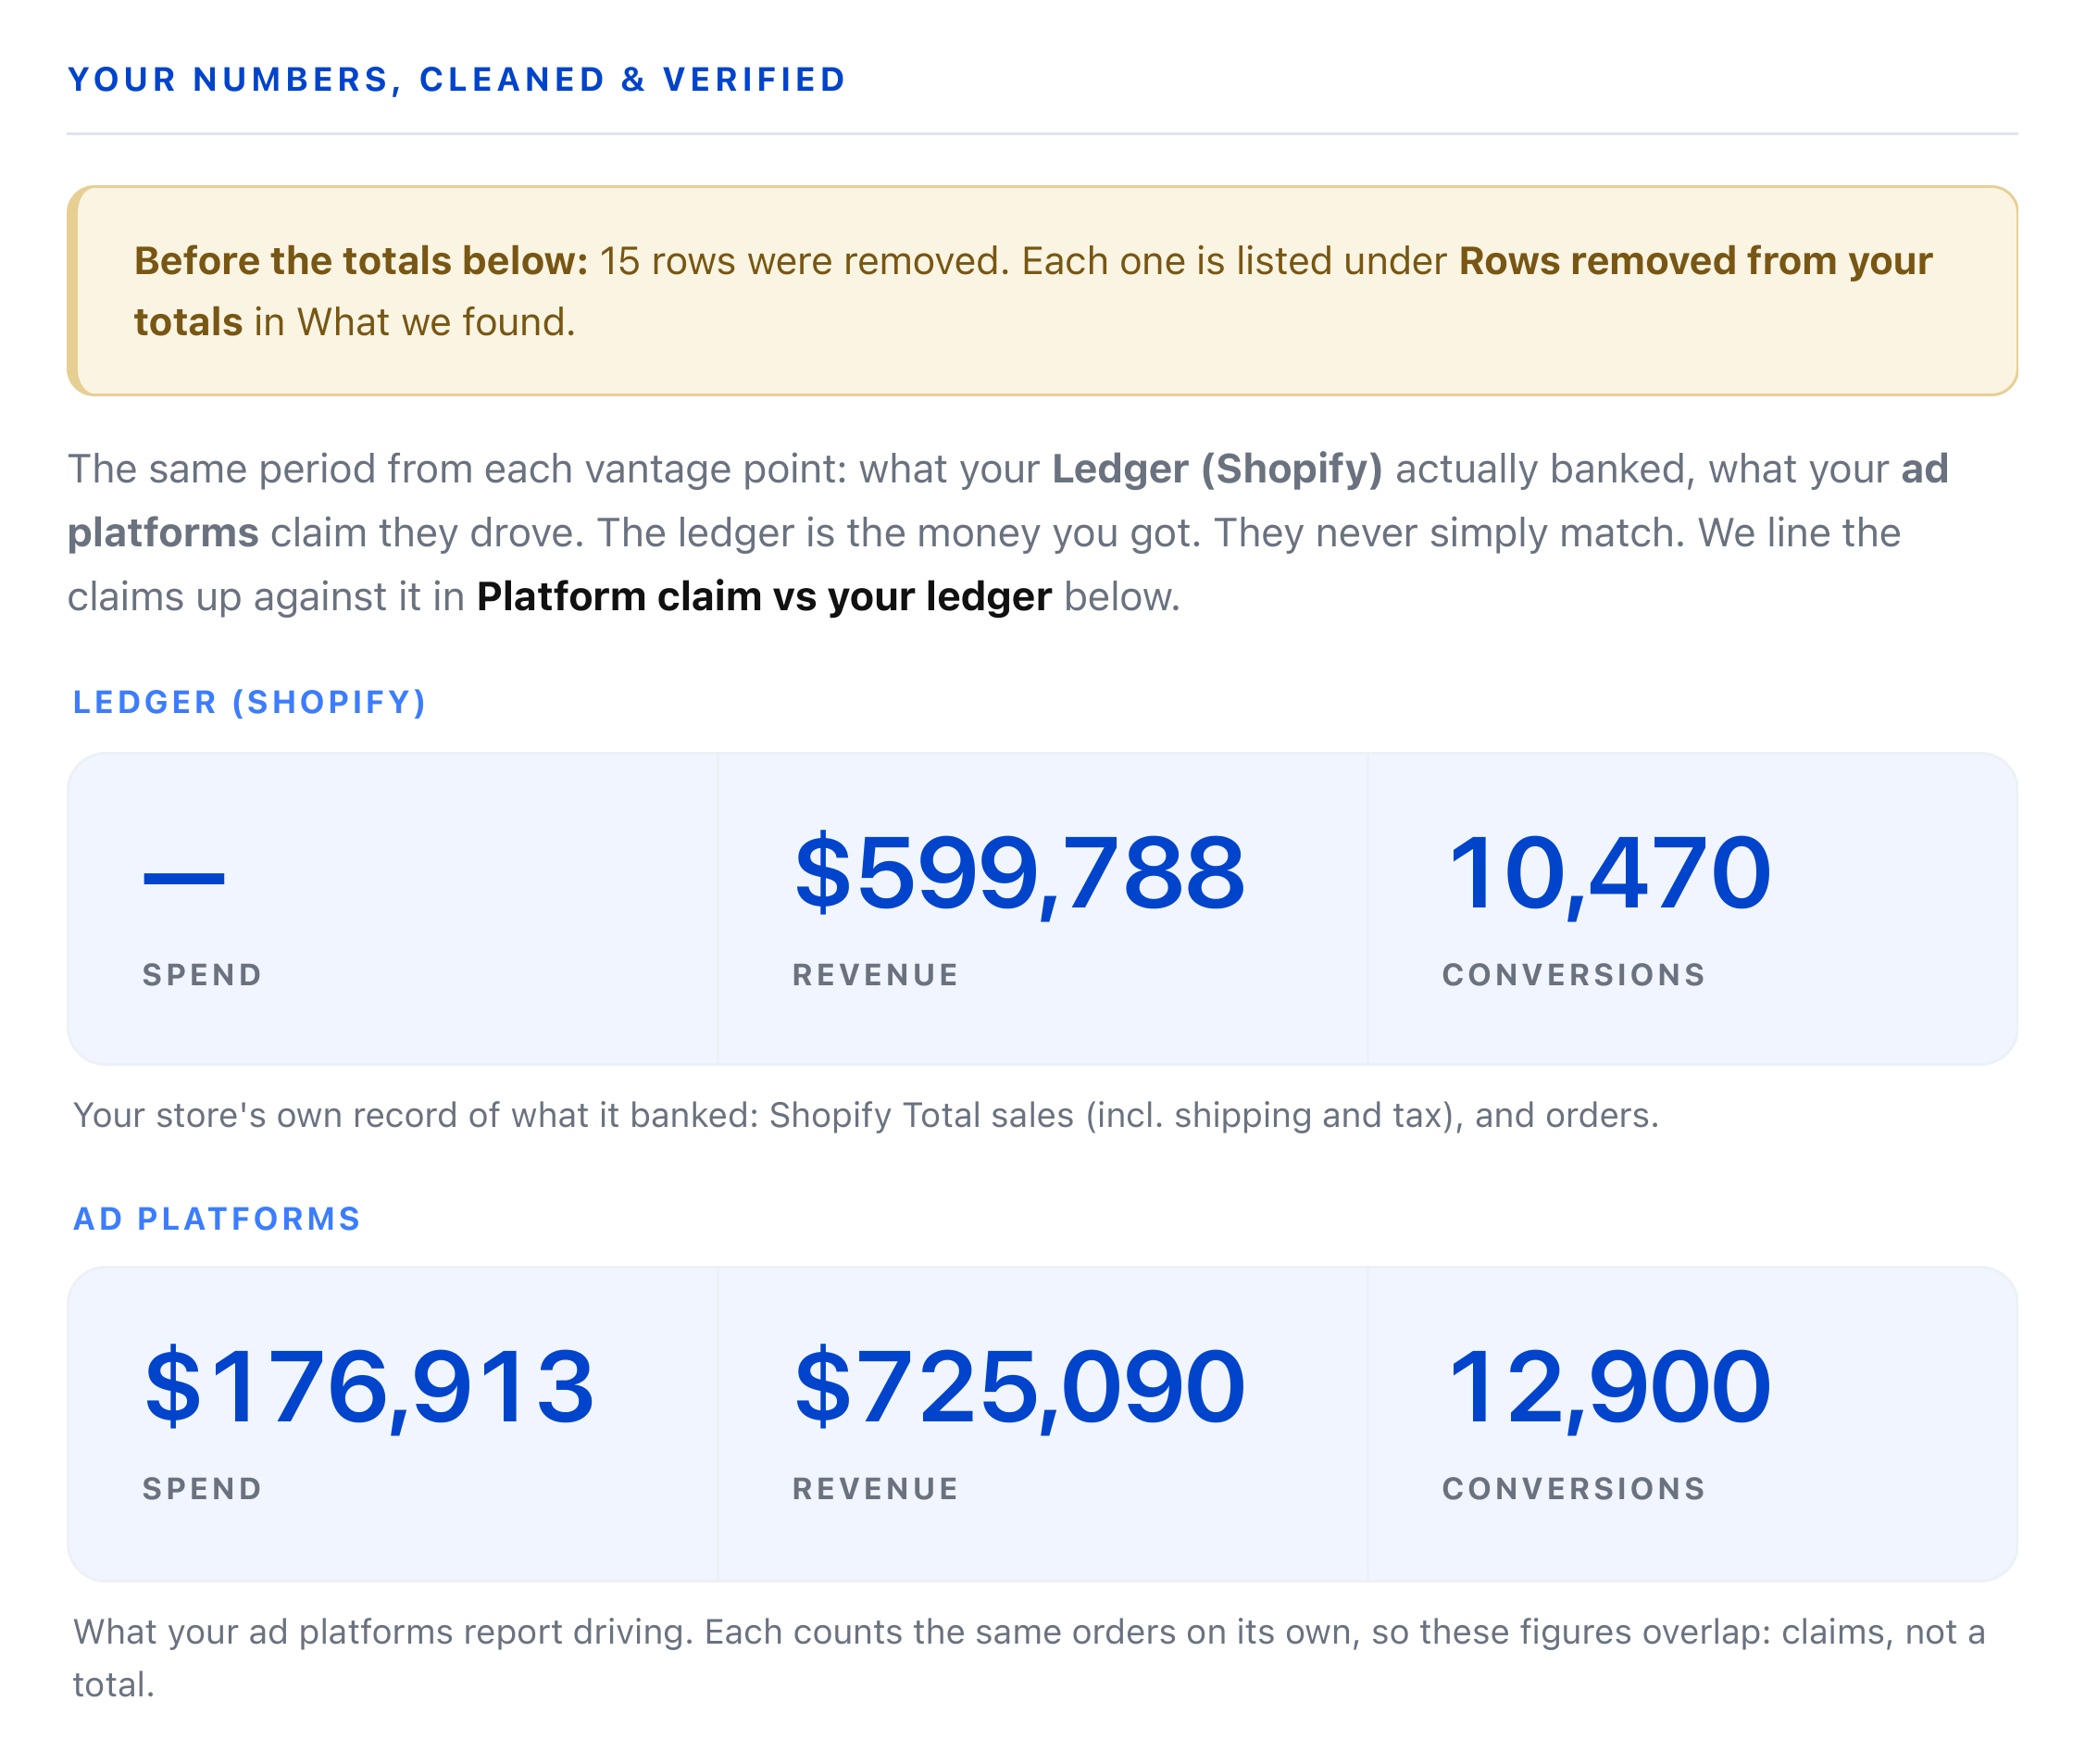
Your numbers, cleaned and verified
Your totals after the audit checks. Your store’s sales and orders appear separately from the figures reported by your advertising platforms.
They are kept separate intentionally. Multiple platforms can claim the same order, so platform figures represent reported claims, while your store’s figures represent the sales and orders you actually recorded. If any rows were removed before calculating the totals, a note above them explains how many.
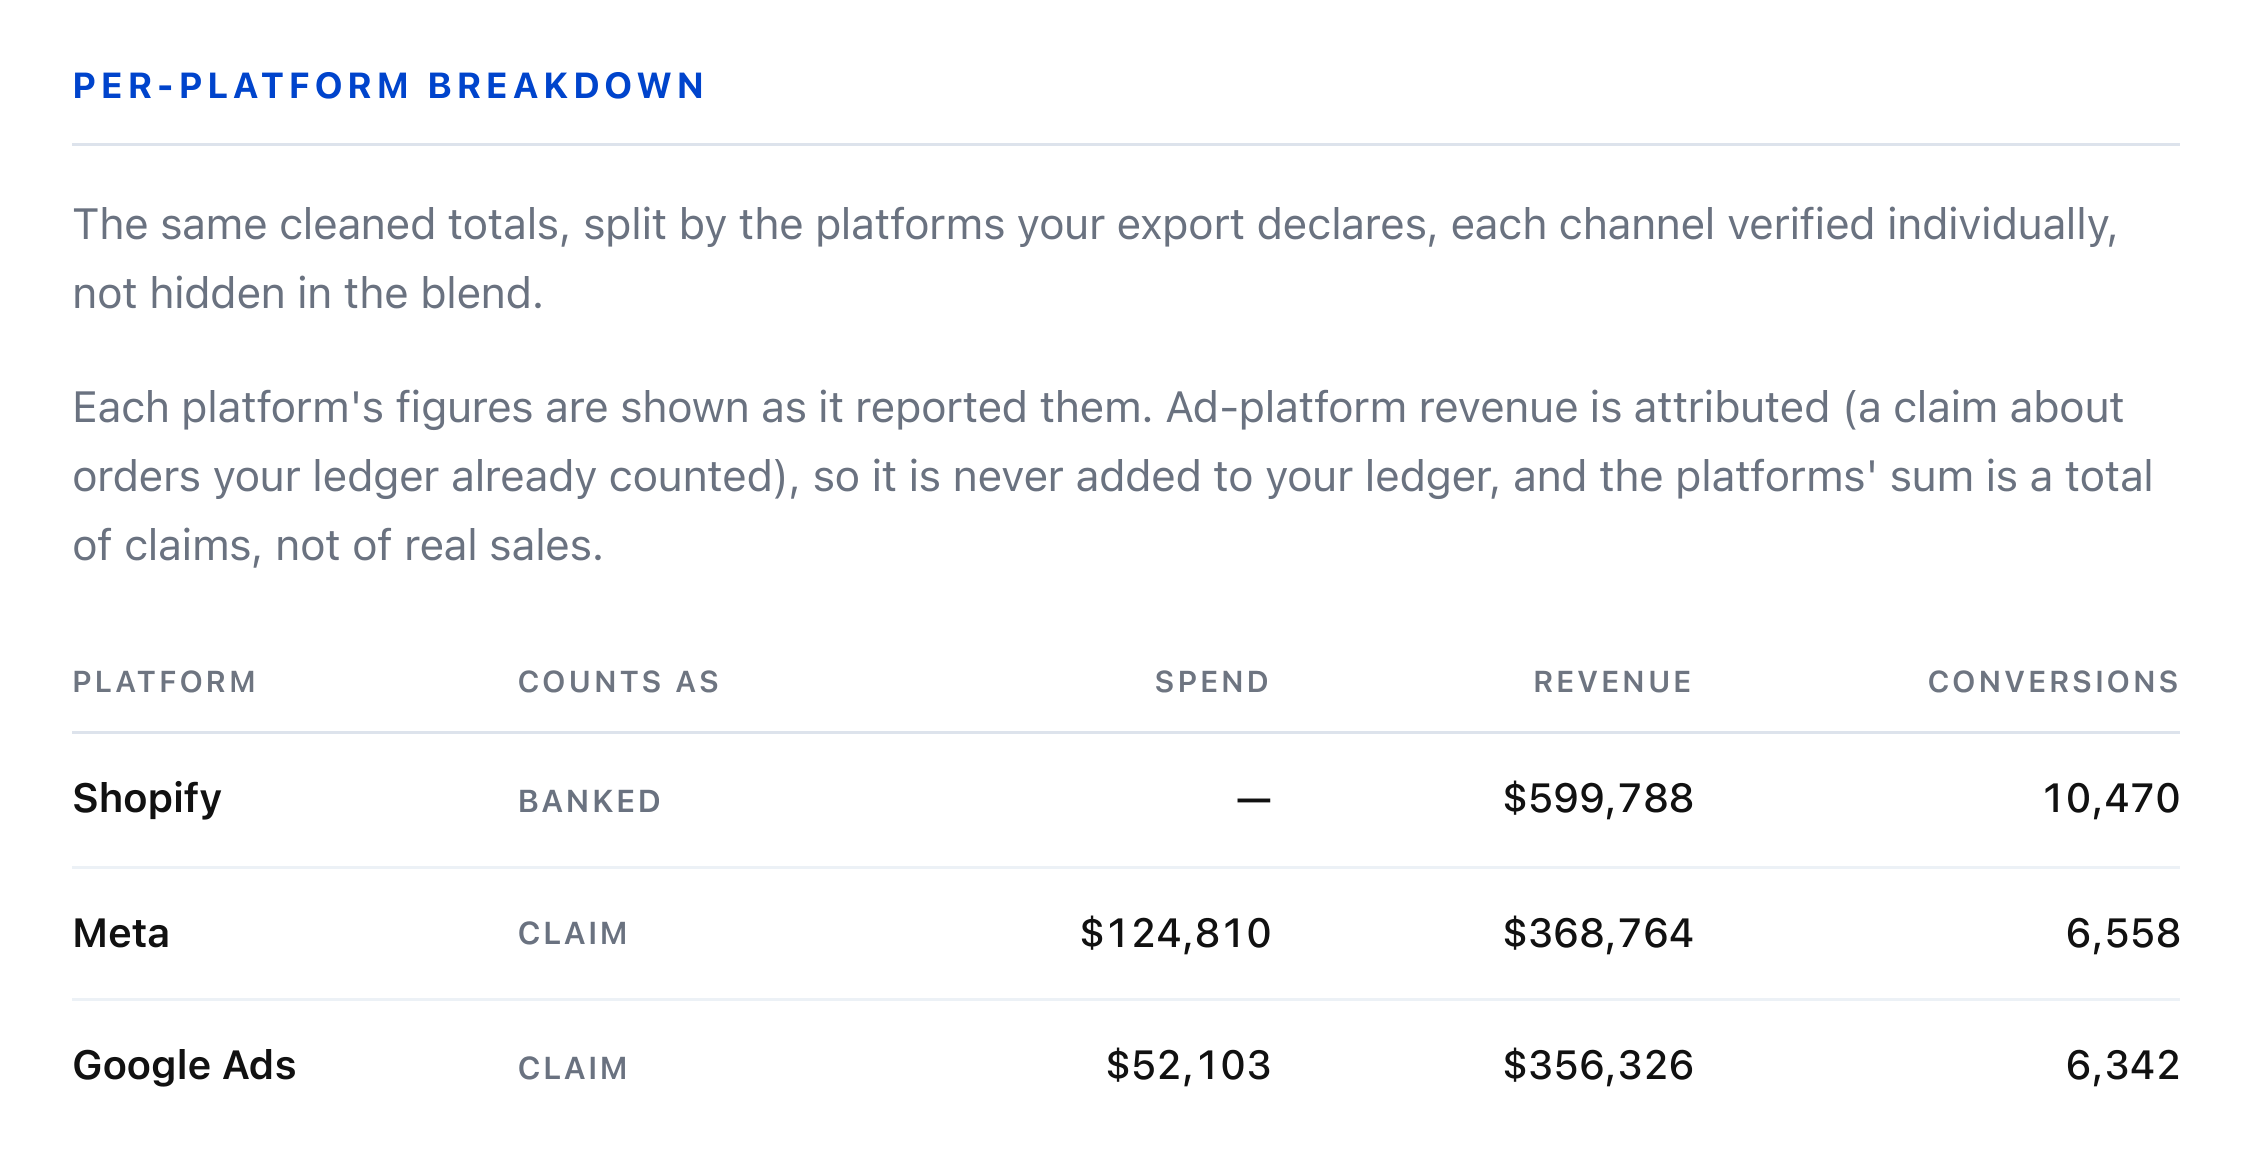
Per-platform breakdown
The same totals for each platform individually: spend, revenue, and conversions, as reported by that platform. Each row is identified as either a record from your store or a platform claim, allowing you to compare platforms side by side.
Platform claim vs your ledger
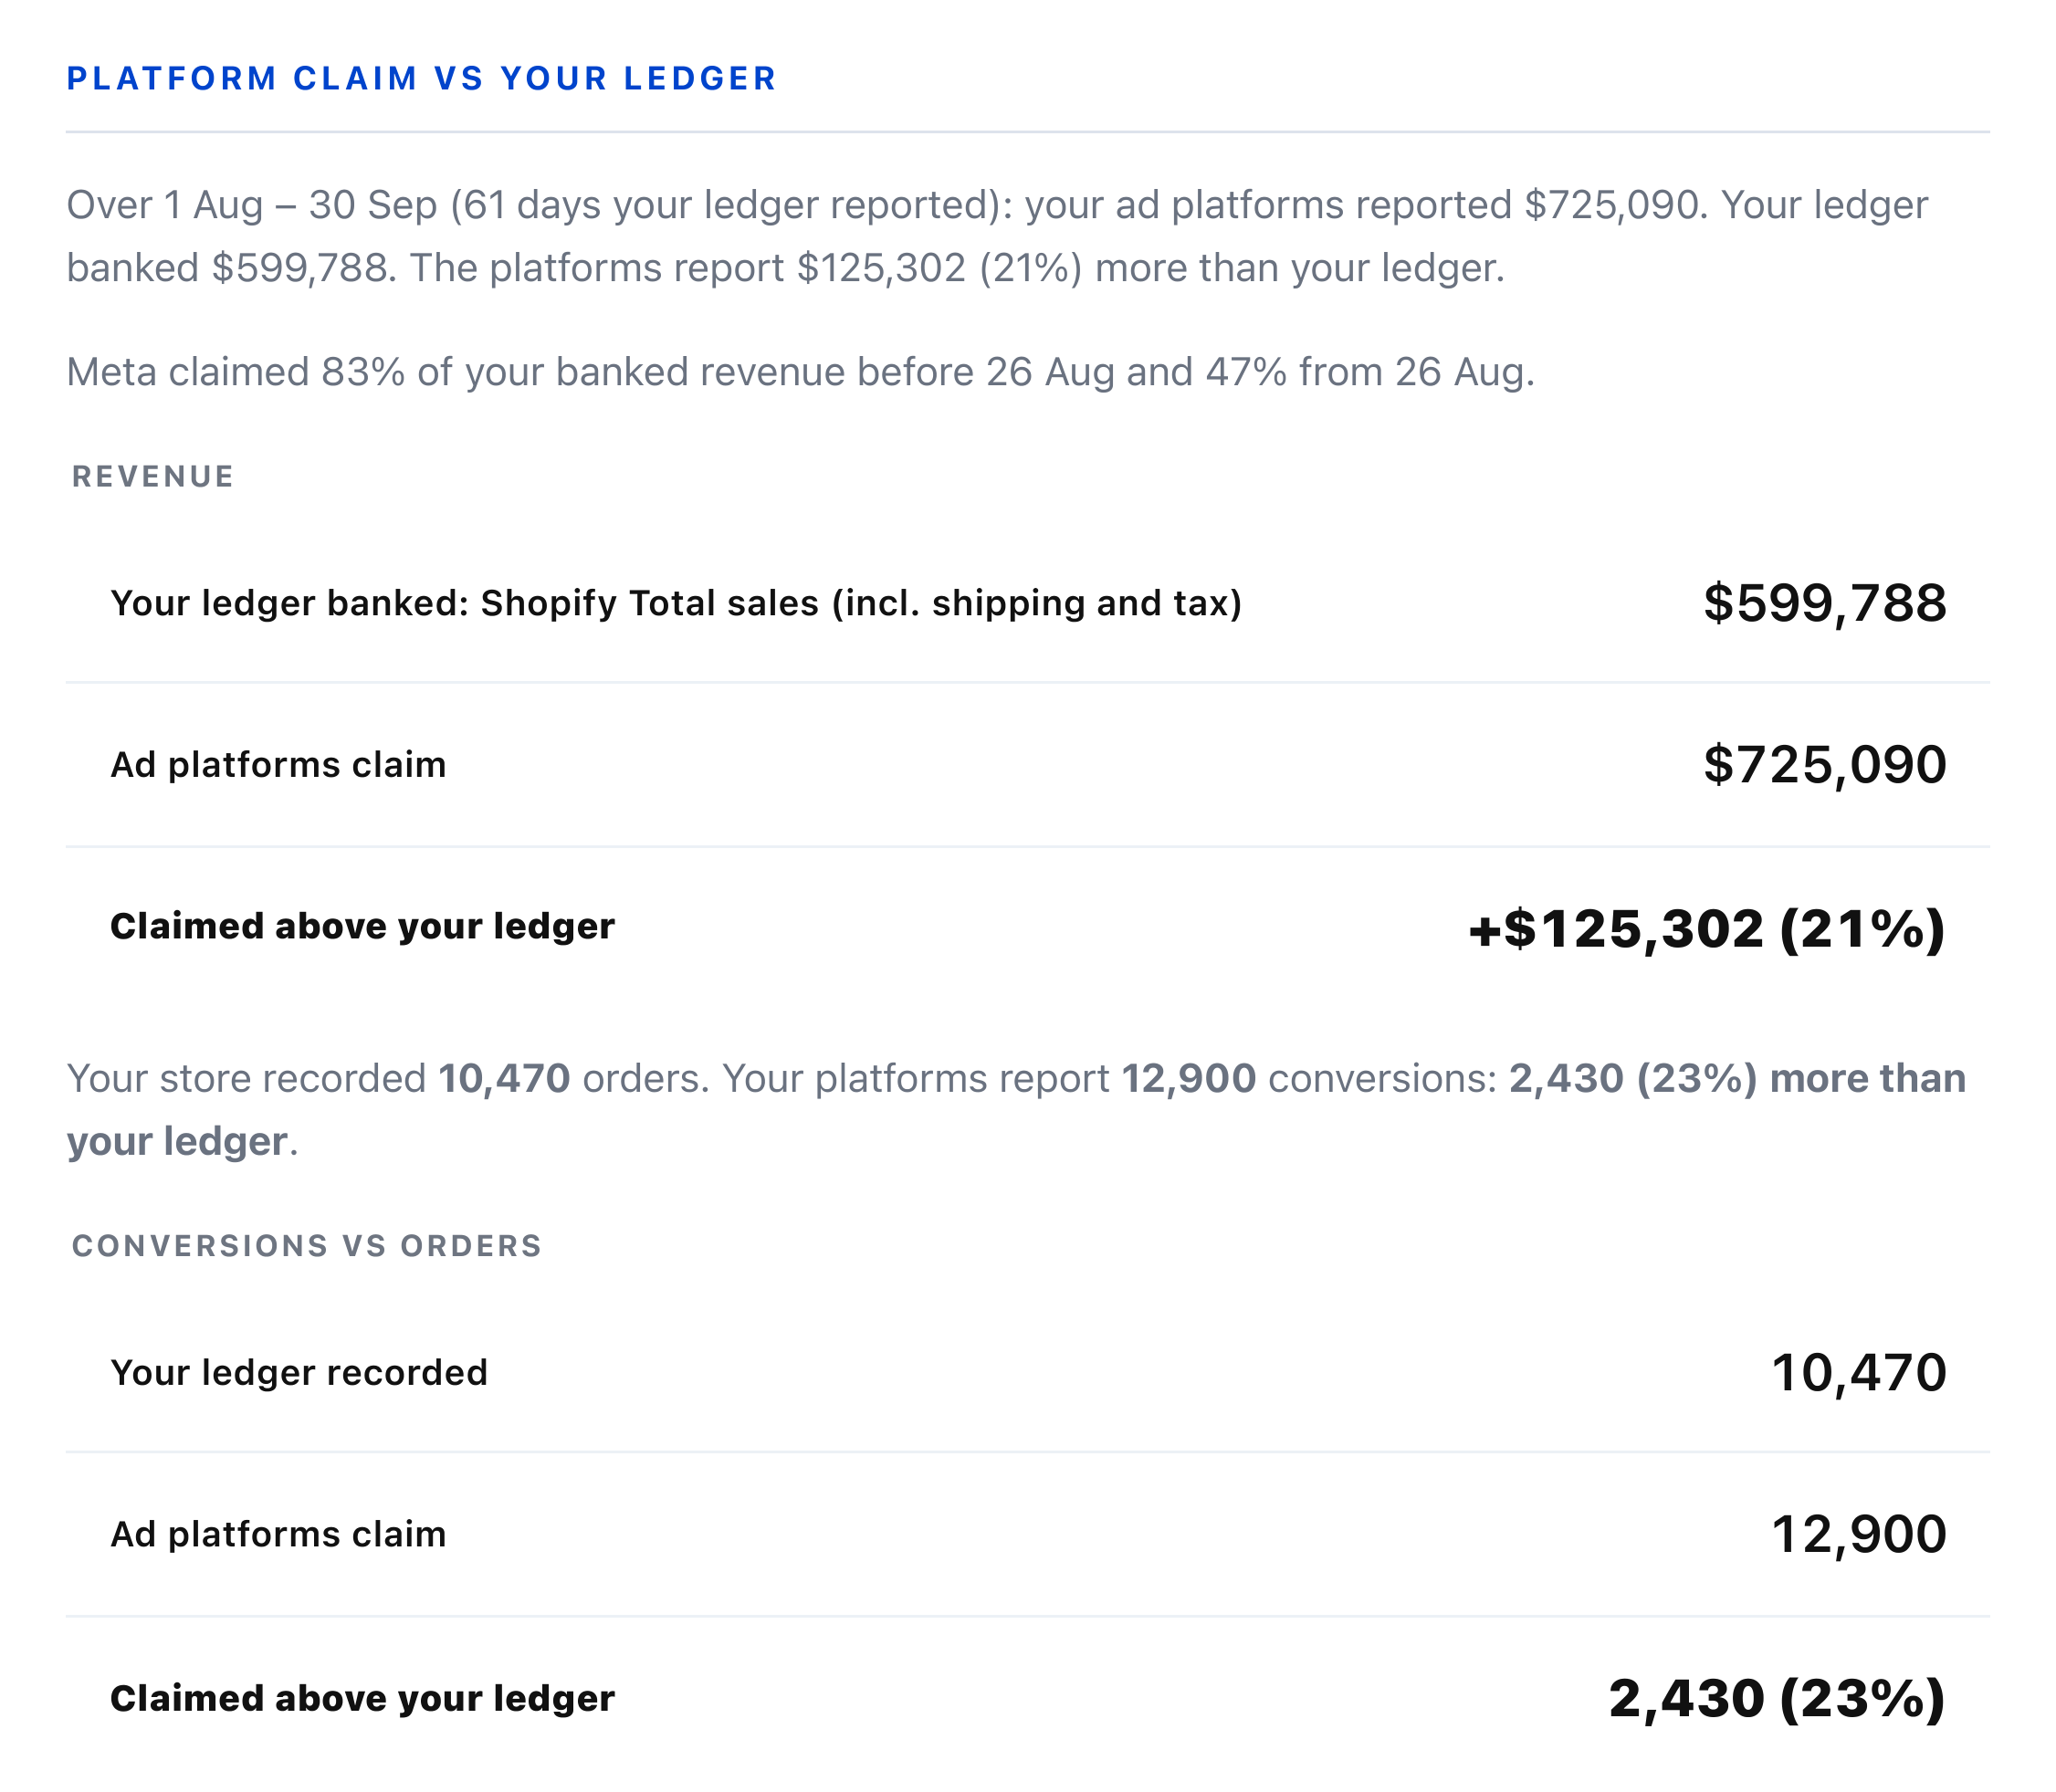
The platforms’ reported claims compared with the revenue and orders recorded by your store. This shows what share of your revenue the platforms claim and whether their combined claims exceed your actual sales. If a platform’s share changed on a particular date, the report shows the share before and after the change.
Your days
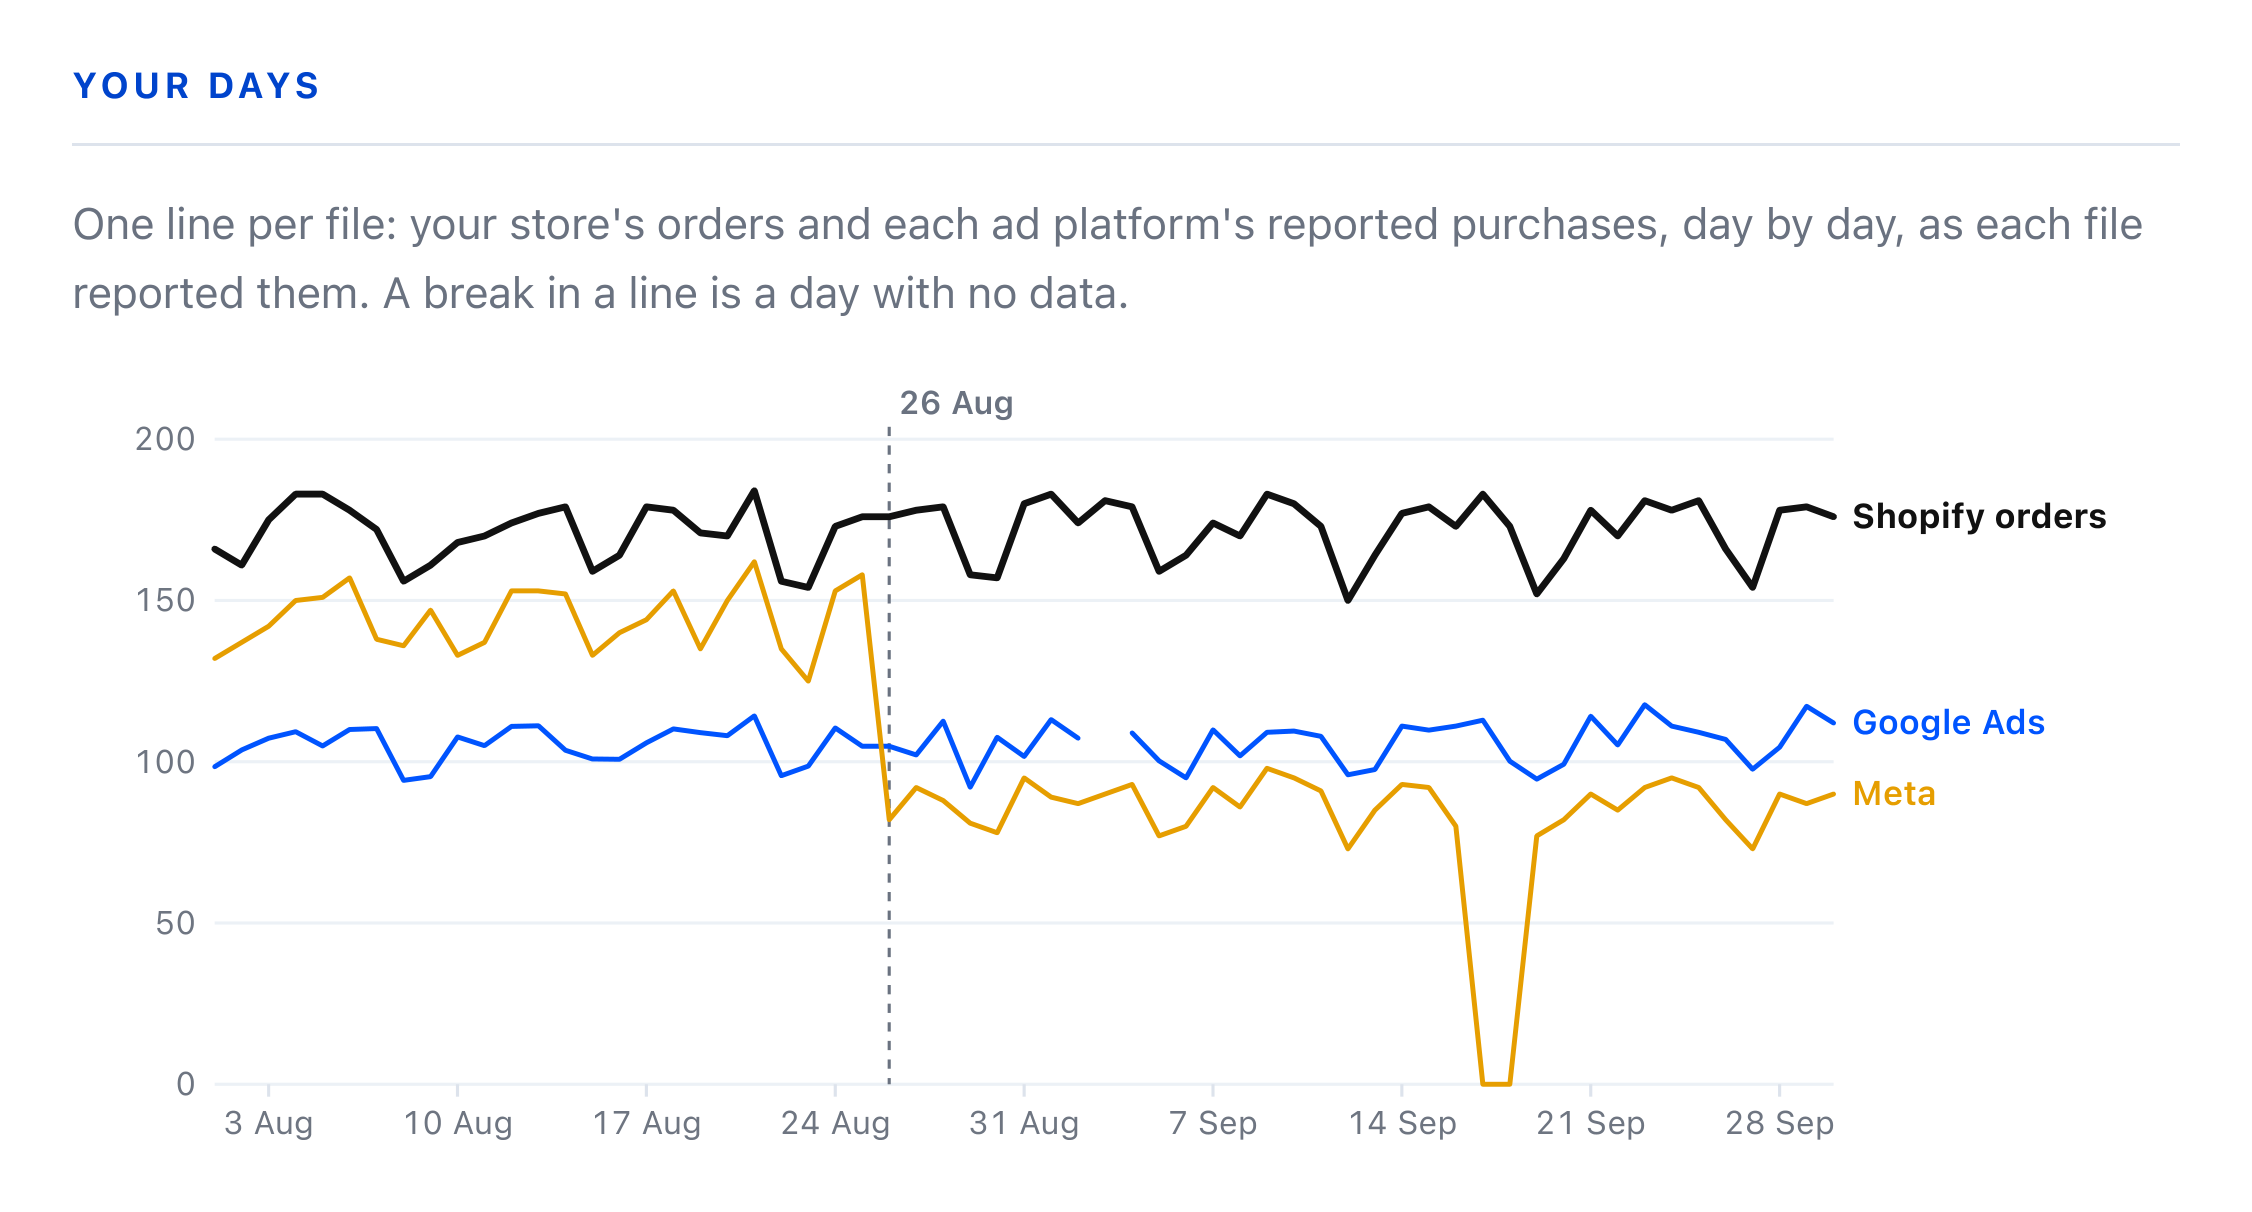
Totals can hide when a change occurred. This chart shows your store’s orders and each platform’s reported purchases for every day covered by your files.
Start with your store’s line and compare the platform lines against it. If your store’s line remains steady while a platform’s line moves up or down, that date is worth investigating. When a platform’s reporting changes, the report also calculates what its earlier rate would have produced on the subsequent days, showing the size of the change.
Days to check
Individual days that stand out, with the figures shown side by side. Examples include a platform reporting more purchases than your store recorded as orders, a platform recording spend but no purchases, or a day missing from a file.

What we found
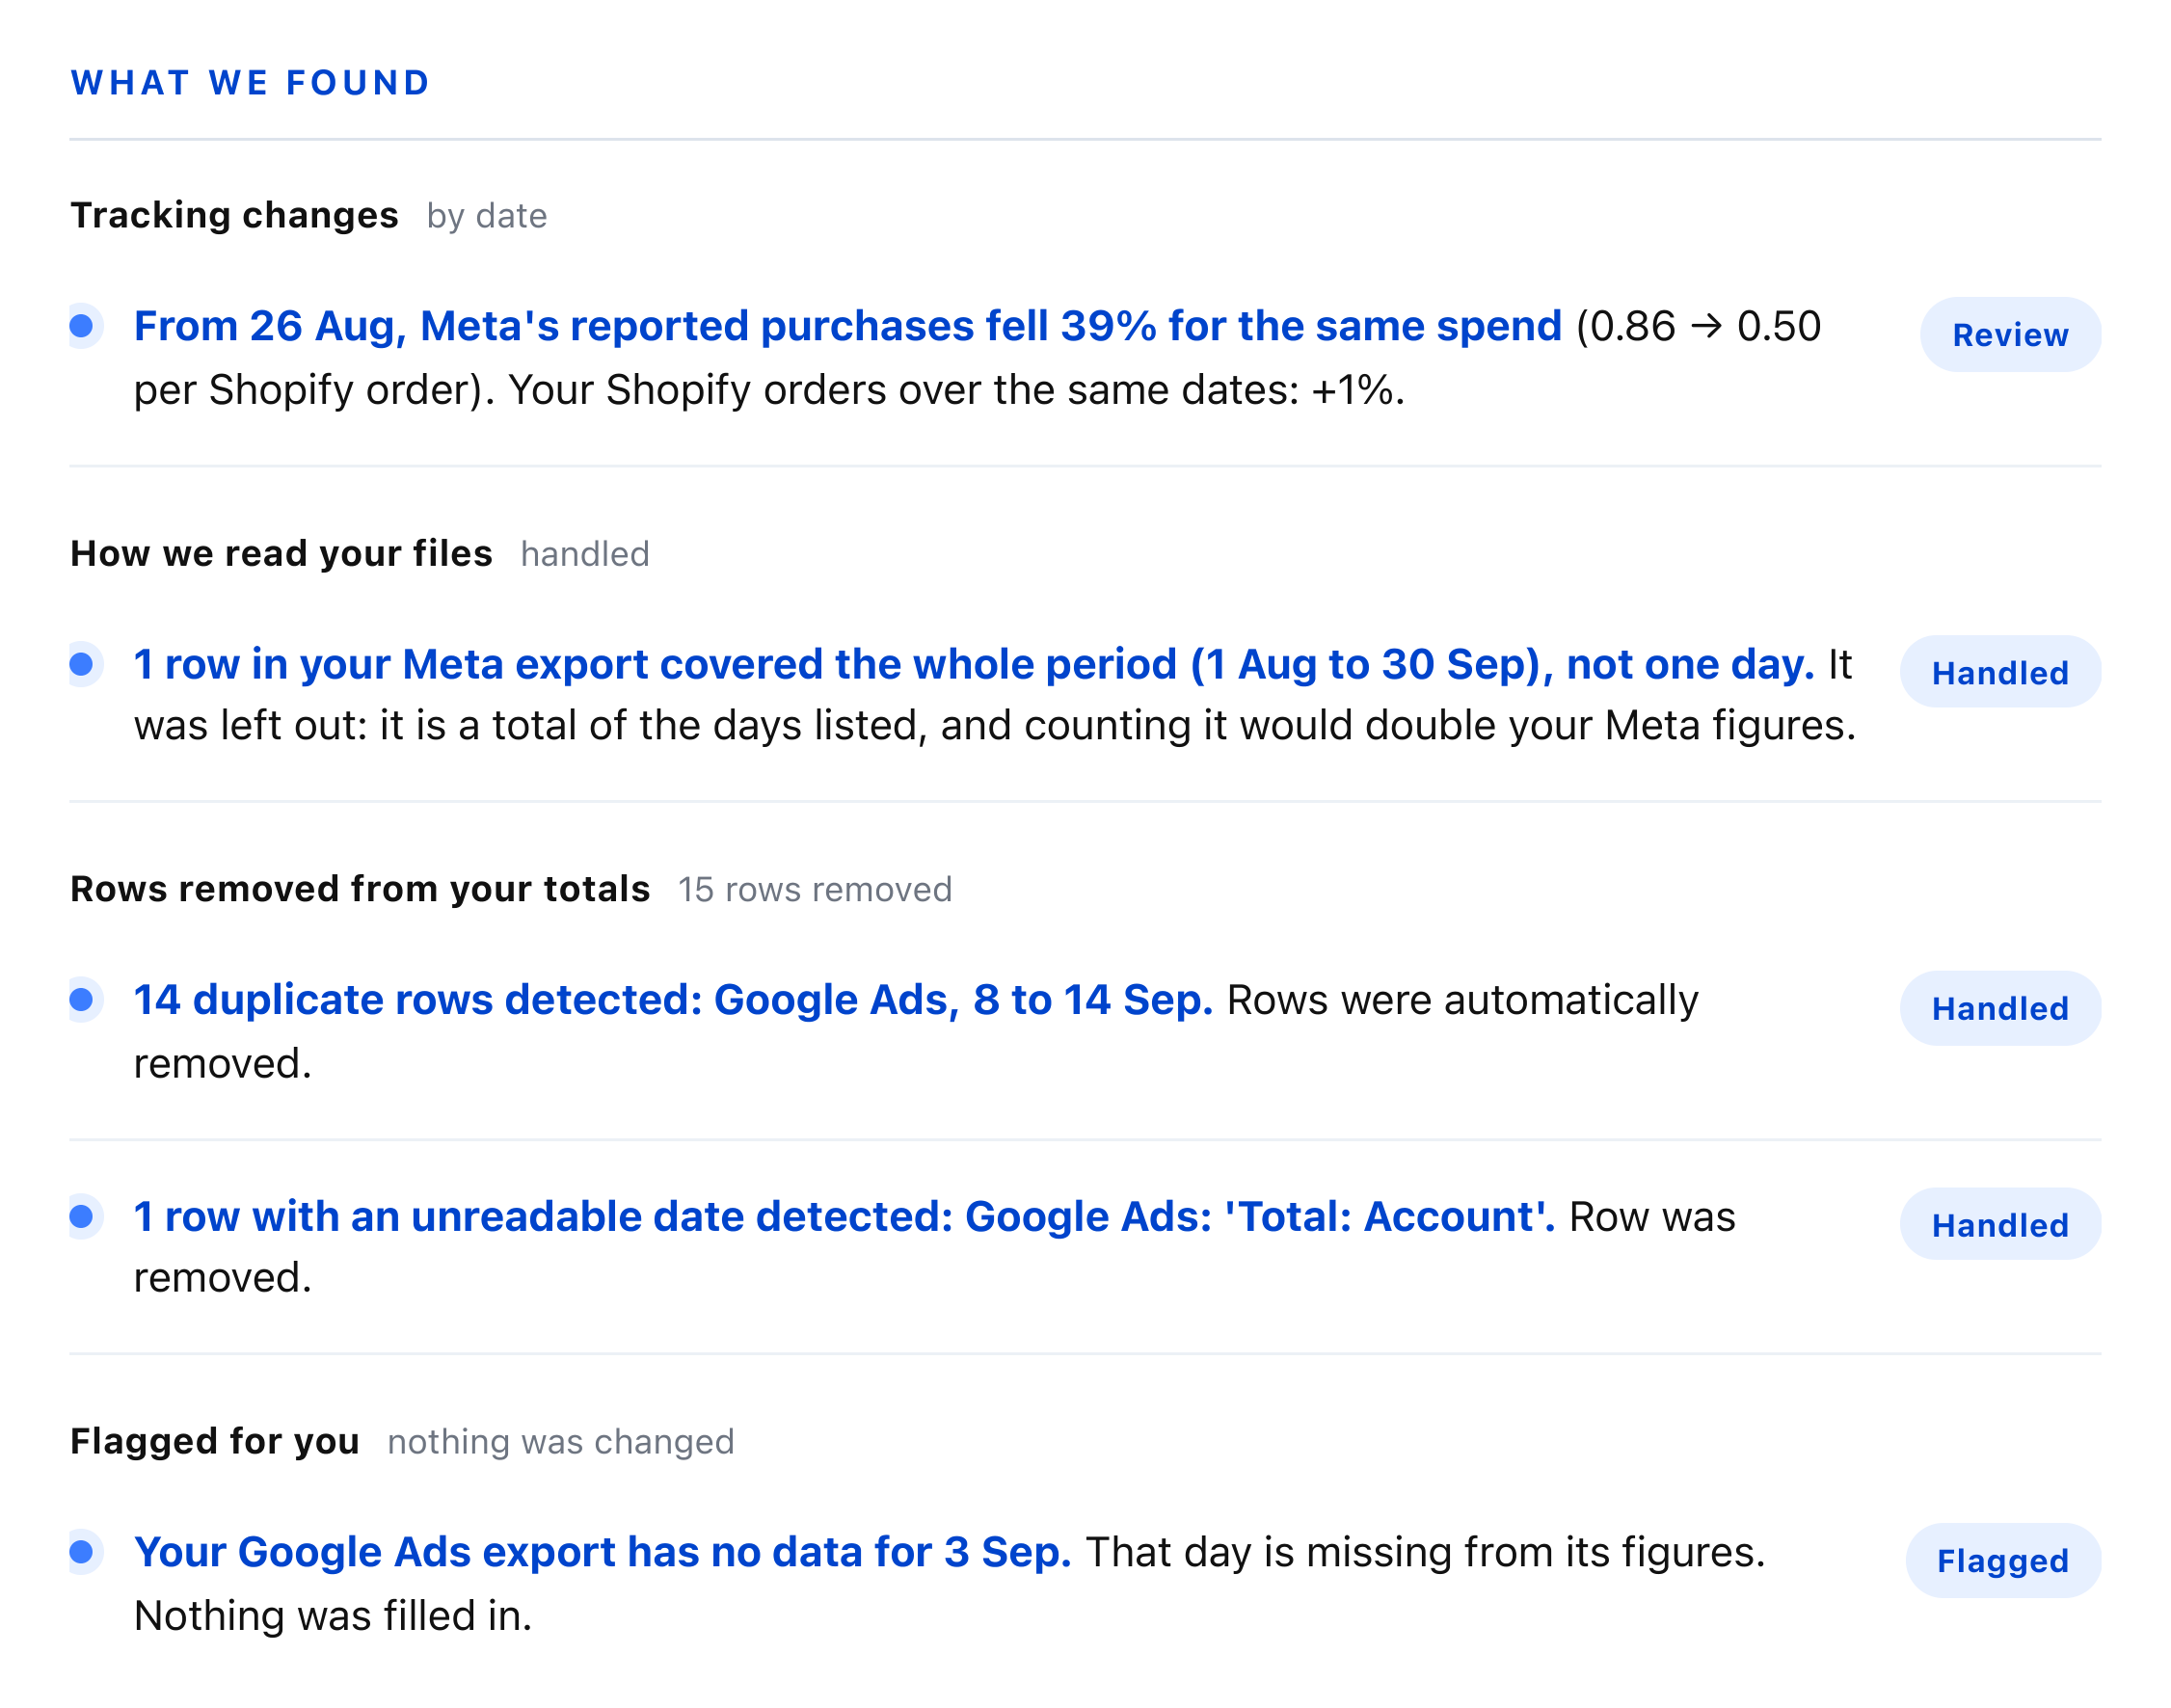
Every finding in your files, organized into five groups:
- Tracking changes: Dates when a platform’s reported figures changed relative to your store’s data, marked for review.
- How we read your files: Export details the audit handled, such as a summary row that could otherwise have doubled a platform’s figures.
- Rows removed from your totals: Duplicate rows and “Total” rows, identified by platform and date.
- Cleaned in place: Values that could not be read as numbers. These are left blank, while the original row is retained.
- Flagged for you: Missing days and empty cells. Nothing is changed or filled in.
Your files are never modified. The report shows the numbers, dates, and reasons behind each finding, so you can decide what action to take.
How to use the Data Health Audit
- Choose the date range you want to review. Any range works, although a few months usually provides the clearest picture.
- Export your store’s sales data by day. In Shopify, go to Analytics → Reports → Total sales over time. Set the report to a daily view and export it as a CSV file. An orders export works as well.
- Export your Meta data by day. In Ads Manager, go to Reports → Breakdown → Time → Day → Export. Include spend, purchases, and purchase value in the export.
- Export your Google Ads data by day. Go to Campaigns → Segment → Time → Day → Download.
- Export data from any other platforms you use by day. For TikTok, go to Reporting, select a daily view, and export the report. For other platforms, use their standard daily report.
- Send the files as they are to support@lumiqo.net. Send them in one email or several, whichever is easiest.
- Receive your report within 48 hours. Your files are used only to prepare your report and are deleted within 30 days, or immediately if you ask us to delete them sooner.
- Read the report from beginning to end. Start with the opening summary, review At a glance, look at the Your days chart, and then go through What we found.
Rosewell Beauty is a fictional store created with sample data. It is not a customer, and its figures do not represent actual results.